

Indicators
MACD Consolidation Indicator คืออะไร? มีการใช้งานอย่างไร?
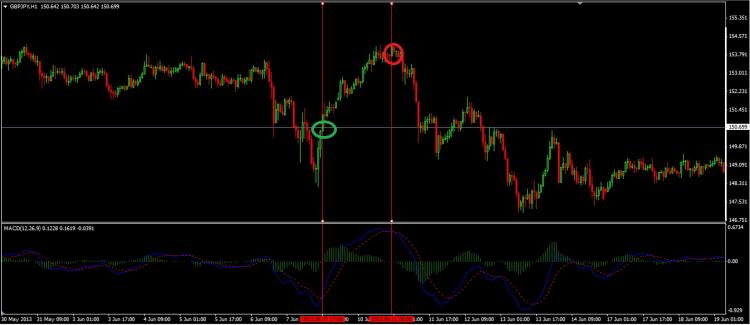
Indicators วิเคราะห์กราฟ MACD Consolidation Indicator ตัวนี้จะมีการใช้งานที่เหมือนกับ MACD ทั่วไป แต่การมองหาจุดเข้าจะง่ายกว่า
จากกราฟจะเห็นจุดเข้าออเดอร์ที่ชัดเจน โดย
– Buy เมื่อ Indicator เส้นสีน้ำเงินตัดเส้นประสีแดงใต้ระดับ 0 ในทิศทางขึ้น และ histogram สีเขียวอยู่เหนือกว่าระดับ 0(วงกลมสีเขียว)
– Sell เมื่อ Indicator เส้นสีน้ำเงินตัดเส้นประสีแดงเหนือระดับ 0 ในทิศทางลง และ histogram สีเขียวอยู่ต่ำกว่าระดับ 0(วงกลมสีแดง)